Fine particles in our atmosphere can travel hundreds of kilometres every day. Their monitoring is crucial as they have significant impact on both human health and the environment.
David D. Cohen, Jagoda Crawford, Eduard Stelcer, Armand J. Atanacio
ANSTO
This is a highlight from ANSTO's Research Selections. Read more highlights from the Research Selections eBook.
Over the last decade, nuclear techniques for studying fine particles in the atmosphere have improved significantly, moving from simply analysing their chemical composition to combining meteorological data, such as wind patterns and trajectory with statistical modelling, to define where the pollution actually came from.
Consequently, it is now possible to not only determine the source of pollution via a chemical composition ‘fingerprint,’ but to also quantify that source’s total contribution of fine particles in a specific location. In short, we can identify individual polluters and measure how many fine particles originated from those polluters.
David Cohen and his team have collected samples in the Richmond area of western Sydney. By using these combinatory techniques of analysing the particles’ chemical composition and taking account of meteorological data with statistical modelling, they are able to quantify the effects of air pollution.
This demonstration project has found that up to half of the total sulfate air pollution in the greater Sydney region can be attributed to emissions from NSW’s eight coal-fired power stations.
Despite being located many kilometres outside of the greater Sydney metropolitan area, these coal-fired power stations have a significant impact on air quality in the CBD areas of Sydney. This information is used by air quality managers to inform pollution control measures and decision making.
Introduction
As atmospheric fine particle pollution has significant impacts on our lives, there has been significant progress over the last decade to better identify its sources and hold polluters accountable. Increased computing power with new algorithms that handle big data sets has played an important role in advancing these studies.
In order to handle multiple observations in environmental monitoring mathematical models are used to analyse the different types of data sets. For the study of air pollution we investigate fine particles and analyse the data using positive matrix factorisation (PMF) and multi-linear engine (ME) methods [1,2] for determining the number and composition of sources of pollution.
Coal-fired power stations are known emitters of fine particles PM2.5 (PM2.5 stands for particles of a size of 2.5 microns or less, i.e. 0.025 mm) and pollutant gases such as SOX and NOX.
ANSTO researchers have developed techniques to determine the contributions of eight coal-fired power stations, which burn over 25 MT/year (yr) of low grade sulfur coal, to the PM2.5 mass loading in the greater Sydney metropolitan area.
We have applied and compared PMF and ME techniques for identifying the source by its elemental fingerprint and quantifying the contribution of a source to total pollution levels.
Using the ME methods we included data of wind observations and profiles the trajectory positions. By combining these various parameters, sources external to the Sydney metropolitan region can uniquely be tied to fine particle measurements made within this region.
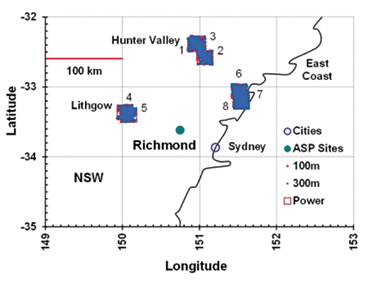
Figure 1A: Locations of eight coal powered power stations supplying Sydney. Boxes labelled 1 to 8 show the locations of the eight NSW coal-fired power stations. The 100m and 300m dots within each of these boxes show the number of wind back trajectories from Richmond site that intersected with each power station. The large symbol (•) shows the location of the Richmond sampling site.
Study Site and Local Conditions
The locations of the eight coal-fired power stations supplying Sydney’s electricity are shown in Fig.1a. The average sulfur content of coal burnt for power generation in NSW at these stations is around 0.5% by weight.
The power station emissions represent 243 kT/year of sulfur dioxide emissions across NSW. In the State of NSW, of the total 290 kT/yr of sulfur dioxide emissions produced each year, over 80% are from the coal-fired power stations.
The sampling site (Fig.1b) was located at Richmond (-33.618°S, 150.748°E) in an open grassed area in the grounds of the University of Western Sydney, 53 km northwest of the Sydney CBD. Samples were taken every Sunday and Wednesday for 24 hours from midnight to midnight.
The site was influenced by sources from within the Sydney CBD region and sources external to the greater metropolitan area, such as the power stations.
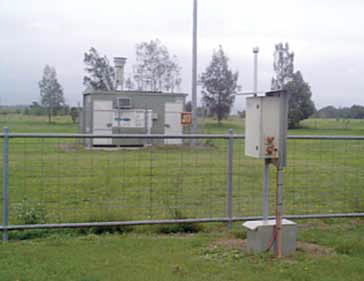
Figure 1B: The ANSTO cyclone sampler (foreground) at the Richmond site of the University of Western Sydney.
Measuring chemical composition
Accelerator-based Ion Beam Analysis (IBA) techniques have been used at ANSTO for many decades to determine chemical composition of fine particulate matter. They are ideally suited to this task as they have the sensitivity to non-destructively measure elements from hydrogen to lead with concentration down to nanograms per cubic metre of air sampled.
These four techniques together with laser absorption methods for black carbon analysis [4] were employed to determine 21 different element species between hydrogen (H) and lead (Pb). During this study, samples were taken every Sunday and Wednesday, providing 912 samples for analysis covering the period 2001-2011.
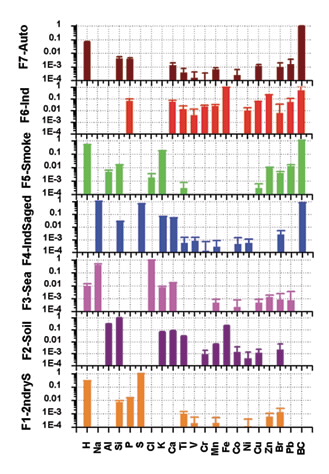
Figure 2: The seven factors or source fingerprints obtained from the standard positive matrix factorisation (PMF) analysis.
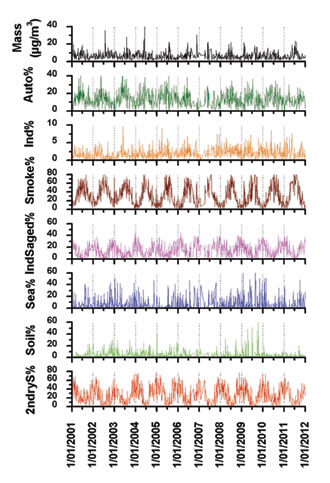
Figure 3: Time series plots for the total PM2.5 mass and the percentage mass contributions of the 7 standard PMF factors or fingerprints.
Positive matrix factorisation fingerprints and source contributions
For a data set of this size, the statistical approach of positive matrix factorisation (PMF) was applied to identify the pollution source by its elemental fingerprints, as well as to quantify the contributions of these sources to the total PM2.5 concentration. Figs. 2 and 3 show the results for analysing the measurements using PMF and Table 1 lists the sulphur contribution for the fingerprints.
We found that seven factors fit the data and we can thus determine the fingerprint of the source, see Fig. 2 and plot their daily contributions in Fig. 3. The total PM2.5 gravimetric mass could be explained to within 2% by these seven fingerprints and each elemental fingerprint was significantly determined at the 99% confidence interval in this PMF model.
The average percentage contributions to the total PM2.5 mass for each of these standard PMF sources during the study period, see Table 1a, shows that the two major sulfur sources, i.e. secondary sulfur (2ndryS) and industrial-aged sulfur (IndSaged), accounted for 40% of the mass followed closely by Smoke from biomass burning with 37%.
Table 1b shows that for the standard PMF analysis 73% of the measured total sulfur was associated with the 2ndryS fingerprint and 27% with the IndSaged fingerprint. The remaining four fingerprints account for 23% of the fine mass, but were not really the focus of the current study as they were generally associated with diffuse or distributed sources and not associated with the eight coal-fired power stations point sources which we want to quantify here.
Fig. 3 shows the daily variations of these seven sources over the 11 year study period. Seasonal (summer-winter) variations are clearly obvious. For example, the winter smoke is 60%- 80% of the fine mass while the summer smoke is generally less than 10%. This is due mainly to domestic wood fires used for heating in the winter in many Sydney homes.
This seven factor standard PMF analysis produced two sulfur containing fingerprints, 2ndryS and IndSaged both of which were a mixture of several possible sources. However, it does not provide a power station fingerprint or a breakdown of how much of 2ndryS or IndSaged sources were power station related. To achieve this we need to apply the more sophisticated ME analysis to our dataset.
% Fingerprint masses for different scenarios
Fingerprint
Standard PMF 7 Factors
ME 9 Factors
Secondary sulfur - 2ndryS (total)
27.3±0.6
25.3±0.8
2ndrySPower
12.7±0.4
2ndrySnoPower
12.6±0.4
Industrial aged sulfur - IndSaged (total)
12.4±0.8
14.3±0.7
IndSagedPower
5.60±0.3
IndSagednoPower
8.70±0.4
Soil
4.76±0.4
4.90
Sea
5.54±0.4
5.40
Smoke
37.1±0.7
33.8
Industry
1.75±0.7
1.50
Auto
11.2±0.8
14.8
Total%
100±5
100±5
Table 1 (a): Percentage contributions to the total PM2.5 mass for each of the fingerprints in the standard PMF analyses and for the ME analyses described below.
Combining wind back trajectories and statistical analysis
Here, we use the multi-linear engine (ME) approach to split the two sulphur fingerprints 2ndryS and IndSaged obtained in the standard PMF analysis into two components each. The first component are contributions of wind back trajectories from Richmond [4,5] which passed over at least one of the eight identified power stations (Power) and the second component are contributions that did not pass over any power stations (noPower).
Consequently, the seven standard PMF fingerprints of Fig. 2 are turned into nine fingerprints which were then analysed by ME techniques. These new methods have been fully discussed in reference [7].
This ME analysis produced not only nine source fingerprints and their contributions, but also a range of power and non-power sulfur source fingerprint masses contributing to the total PM2.5 mass loadings at the Richmond site. This is a unique aspect of this approach as this enabled us to define Power fingerprints and to put limits on the possible contributions these fingerprints – and consequently the power stations – made to the measured fine (PM2.5) mass at the Richmond receptor site. These contributions are summarised by the ME data in the right-hand columns of Table1.
Sulfur contributions (%)
Standard PMF
ME
Fingerprint
7 Factors
9 Factors
2ndryS (total)
72.9±4
74.8±4
2ndrySPower
36.5±2
2ndrySnoPower
38.3±2
IndSaged (total)
27.1±2
25.2±2
IndSagedPower
10.6±0.8
IndSagednoPower
14.6±1
Table 1 (b): Percentage contributions to the total measured sulfur content in the fine PM2.5 fraction for each of the fingerprints in the standard PMF analyses and for the ME analyses described below.
Associating the fine particle samples to their origins
Using PMF techniques we could identify and quantify seven different fingerprints of sources of fine particles collected at the outskirts of Sydney. Two of these fingerprints, secondary sulfate and aged-industrial sulphur were each split in two and, through wind back trajectories, sorted into two groups those passing over coal-fired power stations and those not.
ME techniques together with wind back trajectory data from [6] were then applied to define fingerprints associated with coal-fired power stations as well as quantifying their contributions to total PM2.5 mass loadings.
There are eight coal-fired power stations in NSW burning 25 MT/ yr of coal and emitting 243 kT/yr of SO2 which is converted by water and sunlight to sulfate particles. These power stations were many kilometres outside the greater Sydney metropolitan area, but still had a significant impact on the fine particle mass loadings measured at the sampling site within the metropolitan area. The PM2.5 eleven year average mass at the Richmond sampling site was 6.48 μg/m3. The corresponding ammonium sulfate estimate was 1.65 μg/m3 or 26% of the PM2.5 mass.
The two PMF fingerprints, secondary sulfate (2ndryS) and aged industrial sulfur (IndSaged) accounted for 27% and 12% respectively, making a total of 39% of the PM2.5 mass. Using wind back trajectories we could distinguish these two fingerprints into power and non-power contributions. By subsequently running an ME analysis over them, we were able to produce coal-fired power station fingerprints.
These power related fingerprints were responsible for approximately 18% of the total PM2.5 mass and 47% of the total sulfate measured at the sampling site. On average, up to a half of the total sulfate measured in the greater Sydney region can be attributed to coal-fired power station emissions.
References
Paatero, P., Tapper, U., 1994. Positive Matrix Factorisation: A non-negative factor model with optimal utilisation of error estimates of data values, Environmetrics, Vol 5, 111-126.
Cohen, D.D., Crawford, J., Stelcer, E., Bac, V.T., 2010. Characterisation and source apportionment of fine particulate sources at Hanoi from 2001 to 2008. Atmospheric Environment 44, 320-328.
Cohen, D.D., 1998. Characterisation of atmospheric fine particles using IBA techniques. Nuclear Instruments and Methods in Physics Research Section B: Beam Interactions with Materials and Atoms 136, 14-22.
Taha, G., Box, G.P., Cohen, D.D., Stelcer, E., 2007. Black carbon measurement using laser integrating plate method. Aerosol Science and Technology 41, 266-276.
Draxler R.R., 1991. The accuracy of trajectories during ANATEX calculated using dynamic model analysis versus rawinsonde observations. Journal of Applied Meteorology 30, 1466-1467.
Cohen, D. D., Crawford J., Stelcer E., Atanacio A., 2012. A new approach to the combination of IBA techniques and wind back trajectory data to determine source contributions to long range transport of fine particle air pollution. Nucl. Instru. Methods in Physics Research B273, 186-188.