

It's Australia's longest river yet constant environmental pressures are threatening its livelihood. To better understand what's causing these impacts, environmental scientists are monitoring its water flows with the help of nuclear tracing techniques.
 |
| The Darling River is Australia's Longest River |
Introduction
The Darling River faces environmental pressures from both direct human influence and also climate change. Irrigation demands have dramatically altered the riverine ecosystem over the last century, but during drought it is evaporation and saline groundwater input that impacts the water quality of the river through the formation of algal blooms, salinisation and acidification.
Dryland rivers are particularly challenging to monitor because they experience variable rainfall, low flow and evaporation. This is why more sophisticated tools such as isotopic tracers are being used to establish baseline signatures of these river systems.
Since mid-2002 we have monitored the changes along the Darling River using stable isotopes and subsequently have modelled evaporative losses and saline groundwater input to the river during the long drought of the last decade. Research such as this is being used to help inform decision makers in charge of managing the river system.
Why do we study the Darling River?
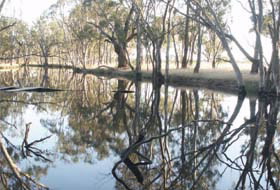
The Darling River is Australia’s longest river (see Fig. 1 in image library below), draining over 8% of the Australian continent, but finally discharging less than 1% of the precipitation that falls in its catchment, into the receiving waters of the Murray River.
This river forms one of the only freshwater supplies in western New South Wales and suffers environmental pressures from over-abstraction, unpredictable flow regimes, evaporative losses, drought and saline groundwater exchange.
The highly regulated nature of this system means that dams divert the vast majority of potential inflows to irrigation, preventing them from flowing into the Murray River.
During drought the main channel of the Darling River often dries up between Bourke and Menindee (Fig. 1), resulting in water quality decline and ecological damage. In this dryland system, evaporative losses and groundwater inputs are very important but difficult to quantify.
How stable isotopes trace water
The stable isotopes of water are very useful tracers to help understand the processes in this catchment.
Variations in the number of neutrons in both the H and O atoms in water mean that some water molecules (e.g. 2H2 16O) are heavier than others (e.g. 1H2 16O).
Consequently, the mass imbalance between these water molecules means they behave differently during phase changes in the water cycle, i.e. there is isotopic fractionation. In different parts of the water cycle, water thus becomes naturally tagged with isotopic “signatures”, which vary according to the history of a particular body of water and its pathway through the water cycle.
The stable isotope concentrations are measured as the difference between the ratio of the heavier to lighter isotopes (i.e. H2:H1 and O18:O16) in a water sample and an international reference water, known as δ notation [1]. As changes in the isotope concentrations are very small, for convenience the δ-values (δ2H and δ18O) are expressed in parts per thousand (‰).
In general, isotopic fractionation during precipitation results in a linear relationship between hydrogen and oxygen isotope concentrations in natural waters, also known as a meteoric water line [1].
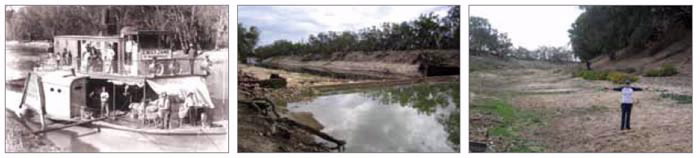 |
The Darling River catchment showing the major stable isotope sampling sites. The photos above from left to right show the Darling River in the late 19th century, Weir 19A at Glen Villa and the dry river bed at Tilpa in May 2007. |
Studying evaporation from the Darling River using δ2H and δ18O
Isotopic fractionation during evaporation increases the proportion of heavy isotope species in surface waters producing enrichment along so-called “evaporation lines” of slopes less than the meteoric water line.
The measured stable isotope composition of river water samples reflects the average of the rainfall events that resulted in the flow. This composition is then modified by the enrichment of heavy isotopes (δ2H and δ18O) during evaporation and the inflow of groundwater with a more depleted signature.
This evaporative enrichment is clearly seen along the Darling River (Fig. 2) during the drought from 2002-2005 with river waters only intersecting the Global Meteoric Water Line briefly following a new inflow (Fig. 2B and C), then enriching rapidly along an evaporation line.
The isotopic enrichment can be modelled using local climate data [3] to determine the proportion of water remaining as indicated in Fig. 2A, which shows the most evaporated waters represent only 20% of their original volume.
Isotopic modelling of the river from June 2002 to December 2003 [2] found that only 0.1 to 1% of precipitation in the catchment reached the river.
Evaporative losses exceeded inflow in many reaches prior to a flow event in March 2003.
During these low flow periods the Darling River is particularly susceptible to contamination from agricultural and urban inputs and increasing salinity from groundwater exchange. Algal blooms and high salinity levels can result in large numbers of fish dying and prevent human and stock use of the precious remaining water.
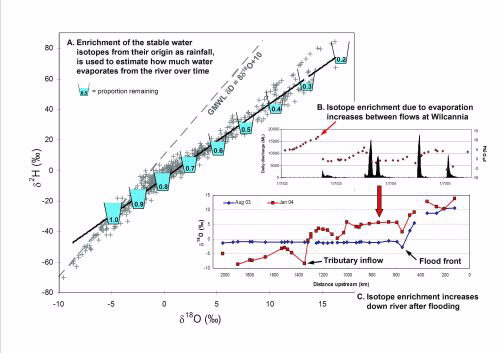 |
A. Stable isotope data for the Barwon- Darling River system showing evaporative enrichment relative to the Global Meteroic Water Line (GMWL,[1]). The proportion of water remaining is shown with the most enriched or evaporated waters found in the Menindee Lakes system. B. Time series showing evaporative enrichment or increase in the δ18O (red dots) between small flow events (black peaks) during a drought period at Wilcannia.. C. Two snapshots of the stable-isotope composition of the river from Mungindi on the Queensland border to Burtundy upstream of the Murray R.These show the effect of a flow or flood on resetting the isotope values (Aug ‘03), then the gradual increase in enrichment as the water moves |
Identifying saline groundwater input to the Darling River
Stable isotopes and chloride (salt) or electrical conductivity (EC) data can also be used to determine the input of saline groundwater into the river. In order to find zones of groundwater inflow to the river, higher density sampling was undertaken in May 2007 along the Bourke to Louth reach of the Darling River (Fig. 3).
During this period ~2400 m3 day-1 flowed past Bourke, but zero flow arrived at Louth. Results showed that chloride and stable isotope concentrations varied significantly over relatively short distances.
At location DR07 (above Glen Villa Weir 19A), the chloride concentration was very low, while δ18O values were enriched relative to other river samples indicating evaporative losses but little groundwater input. River waters approximately 100 m downstream of the weir at DR08 contained elevated chloride concentrations and δ18O values were depleted.
The combination of the salt and isotope tracers allows us to prove that groundwater inflow rather than evaporation of stagnant water has caused the saline spike in the river. A mixing model of surface and groundwaters [4] estimated that between 60 and 99 percent of water in the river at Glen Villa came from groundwater during this period.
This analysis repeated along the river enables us to detect both saline and freshwater inflows to the river (Fig. 3). The flux of saline groundwaters into the river during zero or low-flow periods, such as occurred in mid-2002 to mid-2003 and 2006 to 2007 create ideal environmental conditions for cyanobacteria blooms to develop and cause fish kills, as seen in May 2007.
To look at the impact of this groundwater input over a larger scale for a longer period of less-extreme drought, a model of river flow (MIKE-11) was combined with an EC mixing model and run from May 2003 to Sept. 2005.
This model found that the saline groundwater input represented less than 0.01% of the total flow volume and provided only 12% of the total salt load during that period. So whilst the saline groundwater discharge has an extreme localised impact when the river flow is zero, it is a less significant source of salinity downstream when the river is flowing.
A combined hydrodynamic and mixing model (R-WSIBal) which incorporates both stable water isotopes and EC is under development with promising initial results. Recent flooding along the Darling River now gives us the opportunity to study the system under a different hydrological regime.
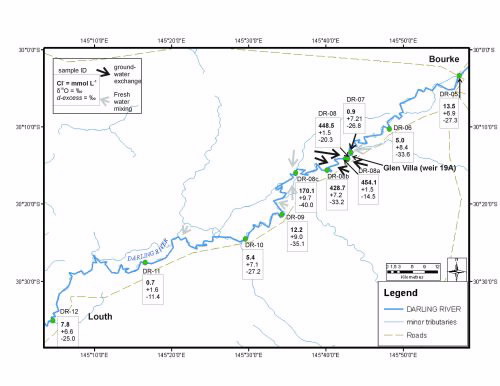 |
| Location of the surface water sample points with Cl (mmol L-1) and the deuterium excess (d) values for May 2007 from Bourke to Louth. Arrows indicate possible water influx locations along the reach. |
Acknowledgements
We would like to acknowledge the support of the New South Wales Office of Water for ongoing access to samples and data. We also thank Tony Barr and Jeff Turner from CSIRO and John Gibson from the University of Victoria in Canada and many ANSTO colleagues for their collaboration.
Authors
Cath Hughes1, Karina Meredith1, Dioni Cendón1, Suzanne Hollins1, Tim Morrison2
1ANSTO, 2University of Technology, Sydney
References
- Craig, H. (1961). Isotopic variations in meteoric waters. Science, 133(3465), 1702-1703.
- Gibson, J. J., Sadek, M. A., Stone, D. J. M., Hughes, C. E., Hankin, S., Cendón, D. I., et al. (2008). Evaporative isotope enrichment as a constraint on reach water balance along a dryland river. Isotopes in Environmental and Health
- Studies, 44(1), 83-98.
- Gonfiantini, R. (1986). Environmental isotopes in lake studies. In P. Fritz & J. Ch. Fontes (Eds.), Handbook of Environmental Isotope Geochemistry (volume 3, pp. 113-168). New York, United States of America: Elsevier.
- Meredith, K. T., Hollins, S. E., Hughes, C. E., Cendón, D. I., Hankin, S., & Stone, D. J. M. (2009). Temporal variation in stable isotopes (18O and 2H) and major ion concentrations within the Darling River between Bourke and Wilcannia due to variable flows, saline groundwater influx and evaporation. Journal of Hydrology, 378(3-4), 313-324.
Published: 12/07/2011